Difference between revisions of "EIA’s projections for individual tight oil plays"
Masoninman (talk | contribs) m (fixed mention of Hughes' report) |
Masoninman (talk | contribs) m (added David Hughes' name) |
||
| Line 35: | Line 35: | ||
The 2014 annual report didn’t show any breakdown like this for all the individual plays. But it did show a [http://www.eia.gov/forecasts/aeo/tight_oil.cfm projection for Eagle Ford]—so I figured they’d continued making projections for other plays. I got a hold of one of their analysts to ask—and it turned out they had made even more detailed projections than I expected, covering more than ten different plays. They sent me the year-by-year data points out to 2040—which also included historical data for each play back to 2000. | The 2014 annual report didn’t show any breakdown like this for all the individual plays. But it did show a [http://www.eia.gov/forecasts/aeo/tight_oil.cfm projection for Eagle Ford]—so I figured they’d continued making projections for other plays. I got a hold of one of their analysts to ask—and it turned out they had made even more detailed projections than I expected, covering more than ten different plays. They sent me the year-by-year data points out to 2040—which also included historical data for each play back to 2000. | ||
| − | I think everyone should have easy access to this data—both historical and projected—so I’ve posted them on Github (links above). | + | I think everyone should have easy access to this data—both historical and projected—so I’ve posted them on Github (links above). Geologist David Hughes' report “[http://www.postcarbon.org/drilling-deeper Drilling Deeper]" (which was published the same day as my post originally went online), compares these same EIA projections against his own. |
== EIA’s historical tight oil data == | == EIA’s historical tight oil data == | ||
Latest revision as of 12:05, 2 January 2015
The EIA gave me their long-term projections—previously unpublished—for oil production from individual tight plays, including the Bakken, Eagle Ford, Wolfcamp, Bone Spring, Spraberry and more, out to 2040. These are the areas wholly responsible for the U.S. oil boom of the past several years, so I’d think there would be wide interest in EIA’s projections for particular plays. Yet the EIA has not released these projections themselves.
I’m posting the data here—freely available—for anyone who is interested. First I’ll show the data, then list links for downloading this data set and some other related data. Finally I’ll tell more about how I got the data, and put it in context.
Data set downloads
To download these data sets as xlsx files, follow the links below to the xlsx pages, then click the button “RAW.”
1. tight oil production projections from EIA’s Annual Energy Outlook 2014 [not previously published]: csv file and xlsx file.
2. tight oil production projections from EIA’s Annual Energy Outlook 2013 (published in that report): csv file and xlsx file.
3. EIA’s historical tight oil production data, through May 2014 [not previously published]: csv file and xlsx file.
EIA’s tight oil projections
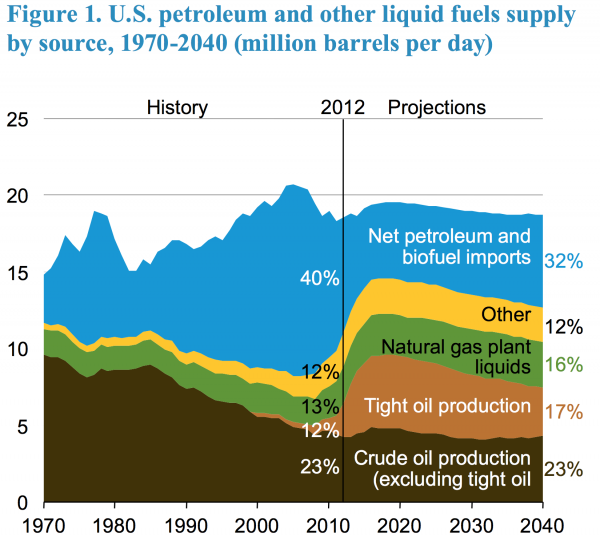
In their 2014 Annual Energy Outlook (AEO), EIA's reference case projection showed tight oil production continuing to rise for only a few more years, then staying on a plateau for a few years, and finally entering a slow decline. If correct, this would mean the U.S. oil boom would soon end—or, it would mean the transition of tight oil production, from a boom phase of rapidly rising production to a mature phase of steady and then falling production.
Figure 1 from EIA’s AEO 2014 (early release).
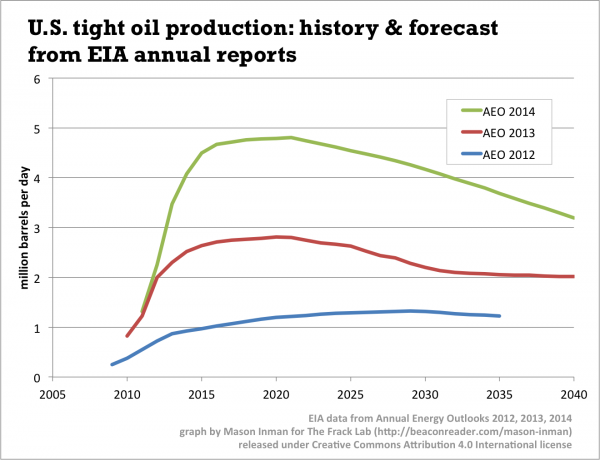
That 2014 projection for tight oil, and for total oil production, was considerably higher than the tight oil projections in their earlier AEOs.
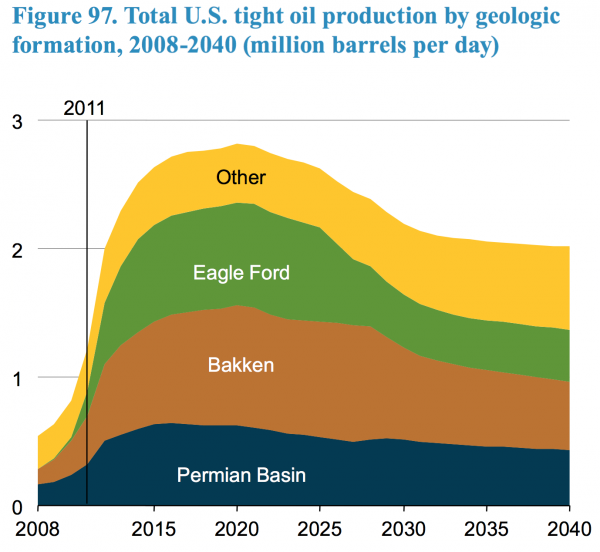
So naturally I was curious to find out what that higher projection in 2014 was based on. Their 2013 annual report had shown a breakdown like this, with the Bakken, Eagle Ford, Permian (which is actually a collection of different plays), and an “other” category.
EIA Annual Energy Outlook 2013, Figure 97.
The 2014 annual report didn’t show any breakdown like this for all the individual plays. But it did show a projection for Eagle Ford—so I figured they’d continued making projections for other plays. I got a hold of one of their analysts to ask—and it turned out they had made even more detailed projections than I expected, covering more than ten different plays. They sent me the year-by-year data points out to 2040—which also included historical data for each play back to 2000.
I think everyone should have easy access to this data—both historical and projected—so I’ve posted them on Github (links above). Geologist David Hughes' report “Drilling Deeper" (which was published the same day as my post originally went online), compares these same EIA projections against his own.
EIA’s historical tight oil data
It’s not easy to get a hold of good historical data on the individual plays—that is, without having a subscription to an expensive database like DrillingInfo. The EIA does show historical production by play for natural gas from shale plays (although as I pointed out in an earlier post, “The original shale gas field is tanking,” the recent months of data may be only estimates—and may get revised).
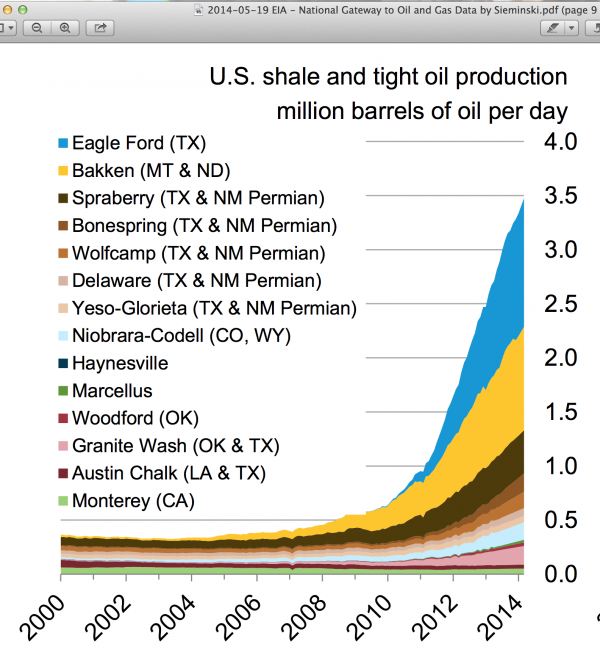
For whatever reason, they don’t provide data on tight oil by play. But in presentations and in posts in their “Today in Energy” series, they do sometimes show graphs of the production by play, like this:
Historical data on tight oil production by play, from September 2014 presentation by EIA executive director Adam Sieminski. The slides noted: “Sources: EIA derived from state administrative data collected by DrillingInfo Inc. Data are through July 2014 and represent EIA’s official tight oil & shale gas estimates, but are not survey data. State abbreviations indicate primary state(s).”
Every month I gather the latest numbers of production of shale gas by play, from EIA’s Natural Gas Weekly Update. In June, when I downloaded the latest data set, I was initially confused. It was listing a different set of plays than usual. I realized it was actually the data for tight oil production by play. They’d accidentally posted the wrong data set, and soon after fixed that. But that gave me monthly production numbers from Jan 2000 to May 2014—a great collection of data to have. The link to that set is above as well.
For what it’s worth, this historical data for each play closely matches the historical portion of the AEO 2014 data I got from EIA.


